
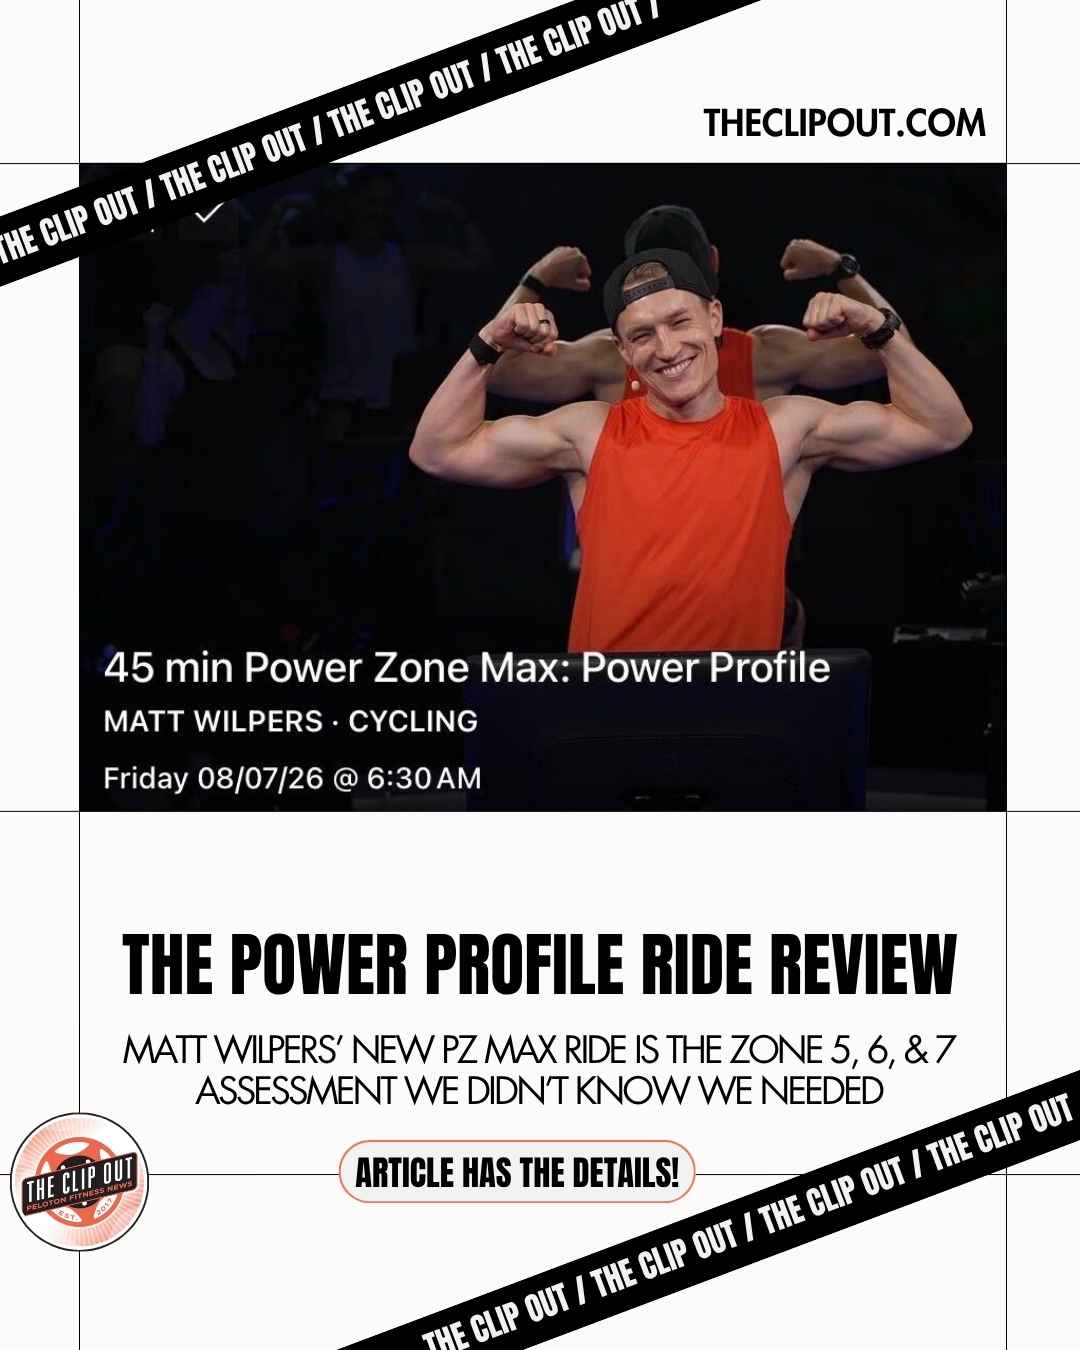
Matt Wilpers Power Profile Ride Tests 3 Fitness Zones
Matt Wilpers Power Profile Ride Reveals The Numbers
A firsthand look at Zones 5, 6, and 7, and what the numbers actually mean once the ride is over.
Who took Matt Wilpers’ Power Profile Ride (aka Power Zone Max) from August 6, 2026? Don’t worry, we did. Here’s everything you need to know for success before, during, and after the ride.
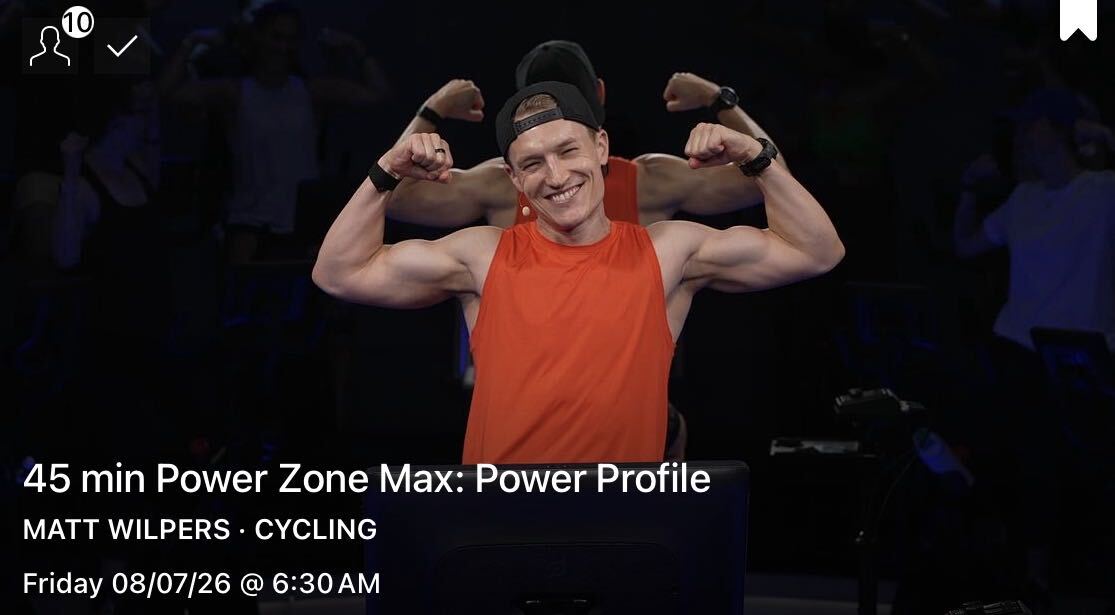
Preparing for the Matt Wilpers Power Profile Ride
If you’ve been following along, you know that here at The Clip Out we’ve been kind of obsessed with Matt’s periodization plan all year. We’ve written about it extensively, and you can catch up on the full picture through our coverage of his original 2026 roadmap reveal.
- The Roadmap
- The Second Peak Block
- The Periodization Plan Tracker
- The Matt Wilpers Power Profile Ride Preview
I’ve been waking up early most Fridays to do his live rides this year, once I drank his periodization plan Kool Aid, and because I suffer from FOMO, for better or worse, I did wake up in time to do this class live at 6:30am ET. I was nervous about hitting Zones 5, 6, and 7 so early (we’d been forewarned!), but luckily Matt had a 15 minute warmup built into the ride. I had time for coffee, a little protein, and his 5 minute stretch before we were off.
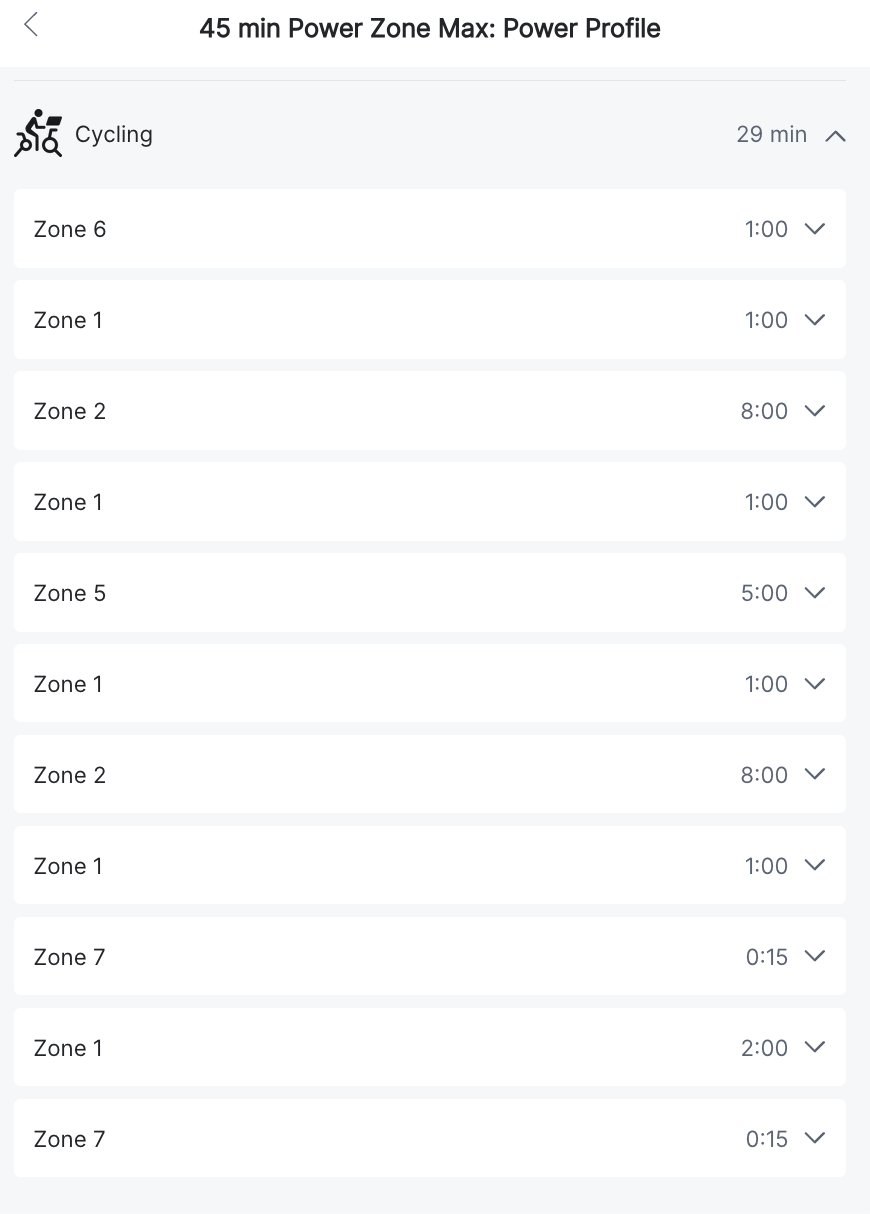
I would recommend at least a stretch, and even another warmup ride, for anyone doing this On Demand. That first Zone 6 interval comes up pretty fast after the warmup. That warmup was five spin-ups, the last one being a full minute, then a build of one minute each in Zones 2, 3, 4, and 5, followed by 30 seconds in Zone 6.
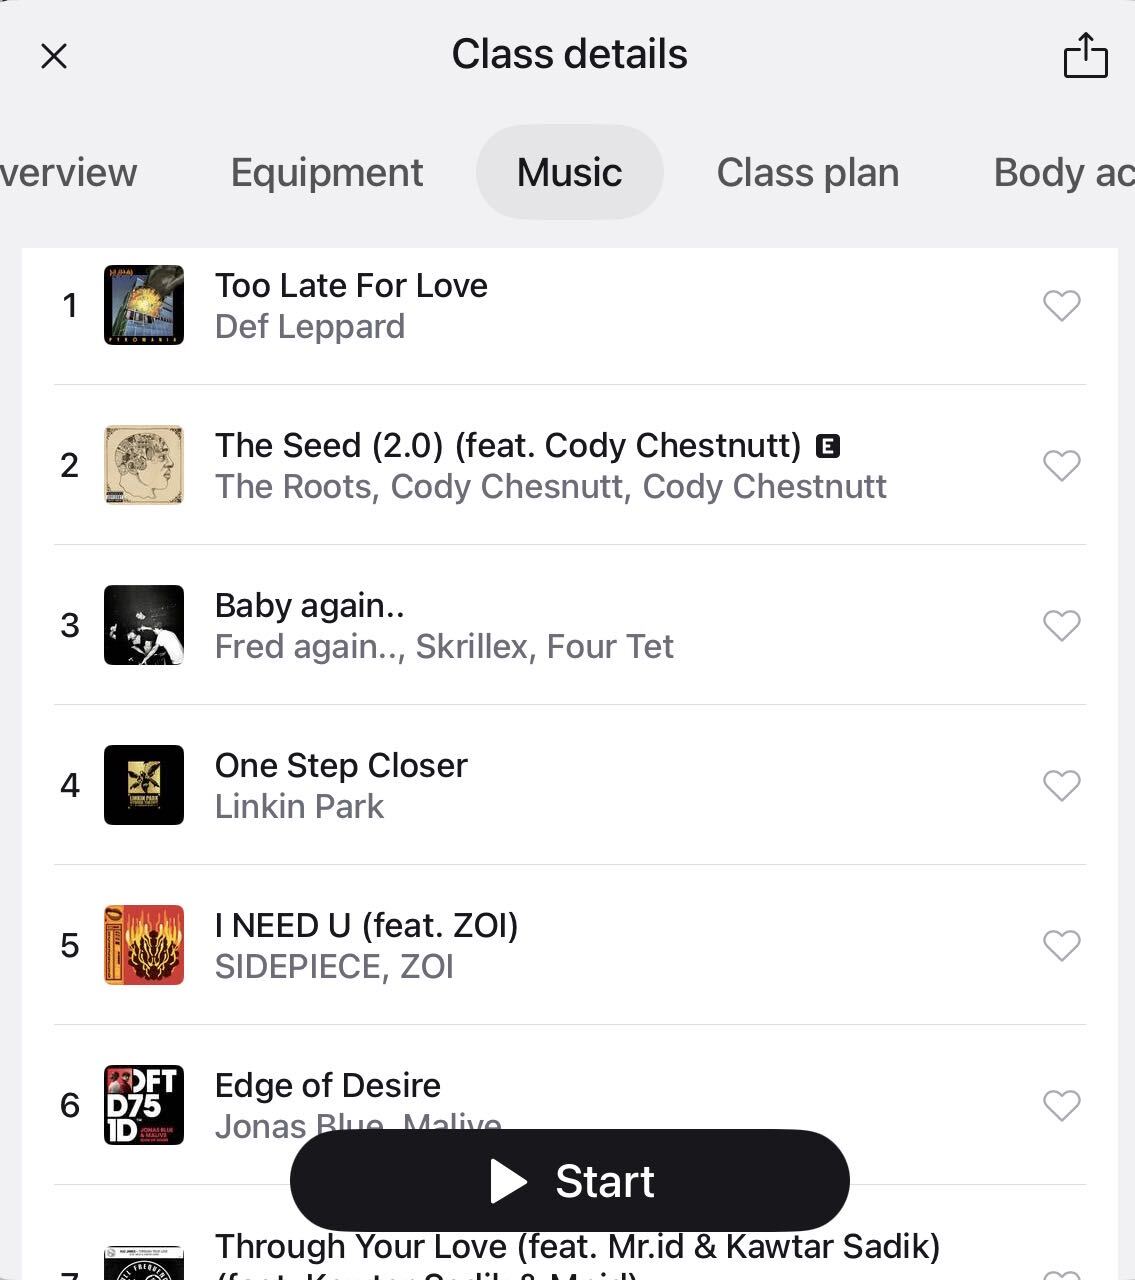
Matt was in fine form, having waited a long time to teach this class. He joked in the first song that if we’d changed our minds, it was “too late,” in the words of Def Leppard. The ride was a blend of rock, EDM, and a little hiphop. Say less!
The Ride
After so much hype, it was a relief to hear that the class plan included two long 10 minute active recoveries in Zone 2, with a little Zone 1, built around three specific blocks of work.
Block 1: One Minute in Zone 6 to Test Anaerobic Capacity
For me, this was a little rough out of the gate, but the short duration was perfectly doable, once. Anaerobic capacity measures how much power you can produce and sustain for a short, high-intensity burst before your body has to rely on recovery rather than continued output. Matt’s choice of “One Step Closer” by Linkin Park, a Power Zone favorite, was actually perfect for getting that aggressive adrenaline released. Then, recovery time. Ten minutes, wow!
Block 2: Five Minutes in Zone 5 to Test VO2 Max
My nemesis, and Matt’s too. A long Zone 5 block is not my favorite way to spend five minutes, but certainly doable, especially with all our solid training this year. VO2 max reflects the highest rate at which your body can take in and use oxygen during hard effort, and it is a strong marker of overall aerobic fitness. It was a lot easier for me to do it here, once, than the rides where we do this same block multiple times.
The second recovery brought the usual chit chat about data, the kind of thing where if you know, you know, and if you love it, you’re already in the right place. Matt explains it all, everything you ever wanted to know about power-to-weight ratio. Personally, I don’t use this metric much myself, so I was excited to finish the ride and check the charts. BikeRadar has a solid breakdown of why watts per kilogram matters and how it is calculated, if you want the fuller explanation, but I’ll also share some thoughts below.
It was also useful, if not new information, to hear Matt reiterate that none of this is anything he invented. He is just bringing it to us this year (and we are here for it!) but there is a lot of existing info out there. He joked that he just set it to music for us.
Block 3: Two 15 Second Sprints in Zone 7 to Test Neuromuscular Power
This was the only effort we got two chances at, and we even got to come out of the saddle if we chose to. Matt reminded everyone there is no real ceiling in Zone 7, so the goal is simply to find your best five seconds (within the fifteen) on each try. I was surprised that with just two bursts, I didn’t feel nearly as rough as I usually do after a SIT ride. I did go as hard as I normally do on these.
A cooldown and stretch later, I was ready to check the numbers.
The Data
So we survived the ride. Now what?
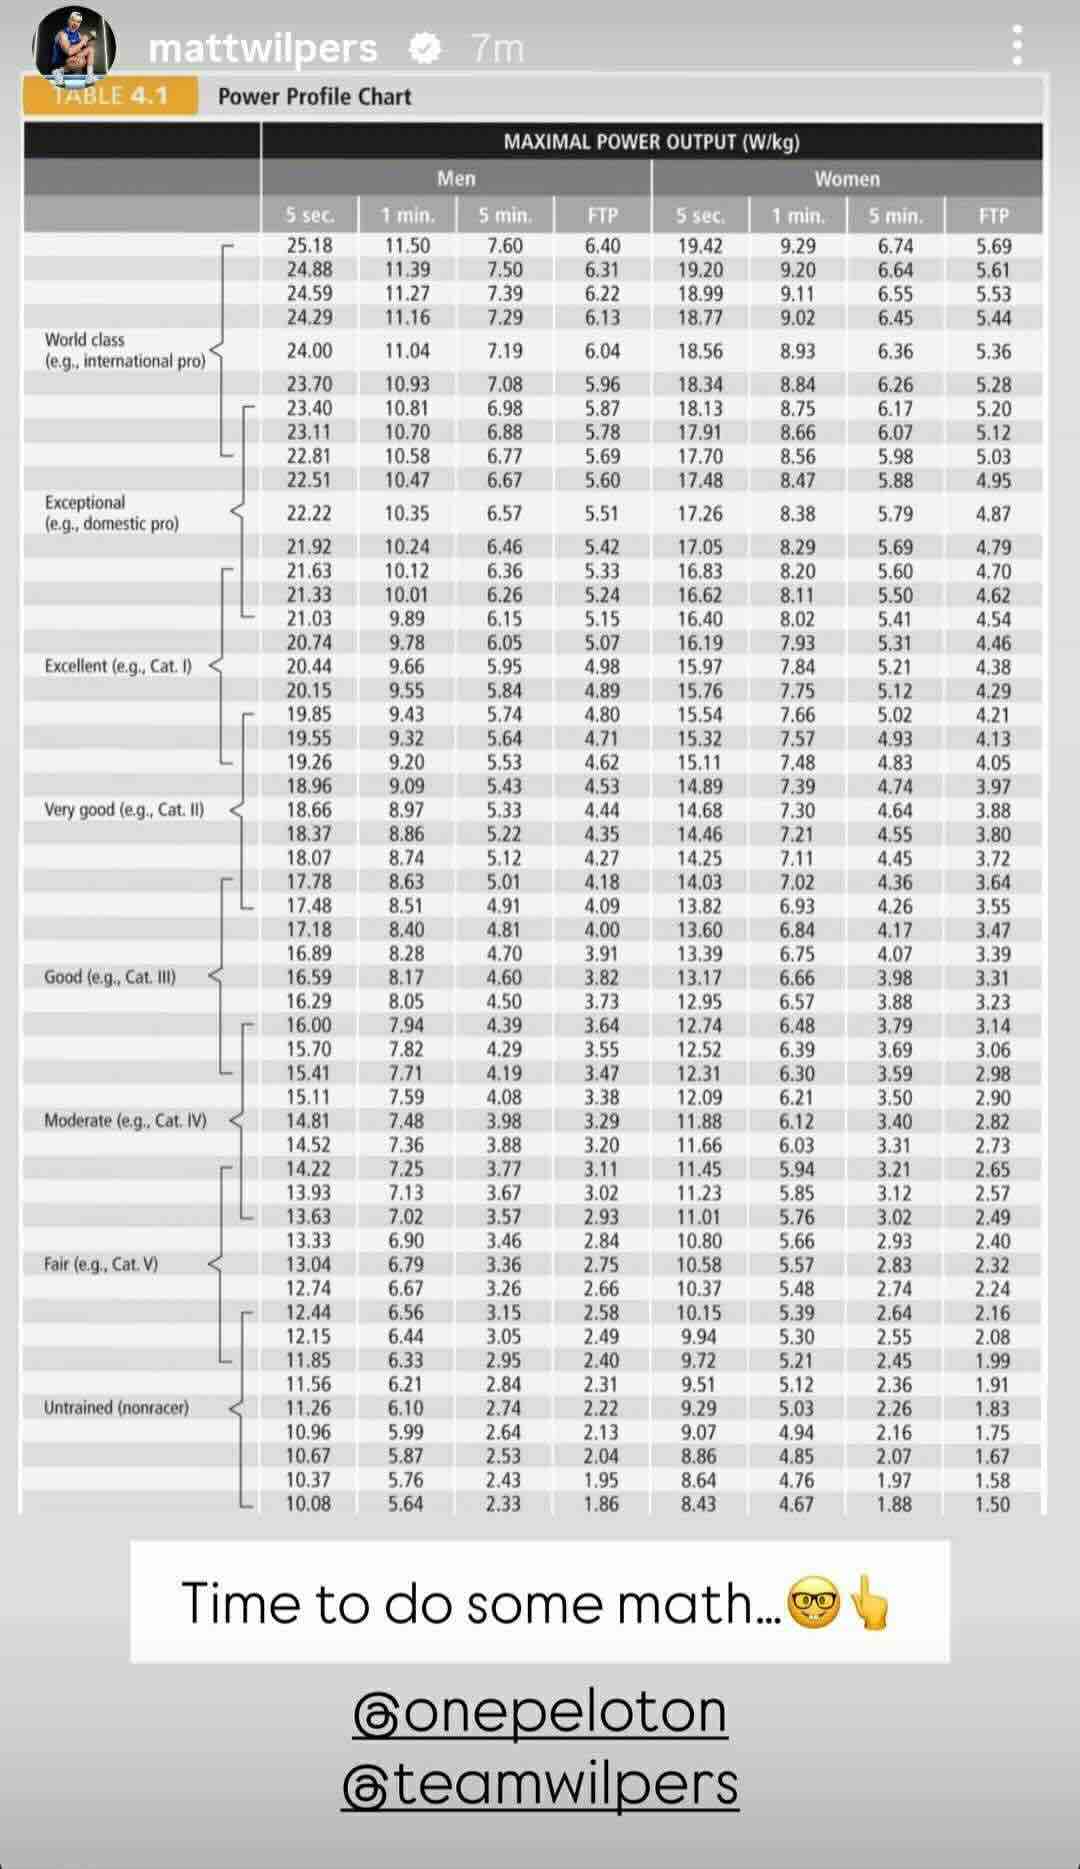
Luckily, Matt posted his choice of chart not long after class ended. According to that chart, here is how you assess your own power-to-weight ratio.
- Find your average output for the 1-minute, 5-minute, and 5-second effort (more on that below).
- Convert your body weight to kilograms.
- Divide each output by your weight to get your score for each effort duration.
- Go to the chart and see what category your number lands you in for each effort type.
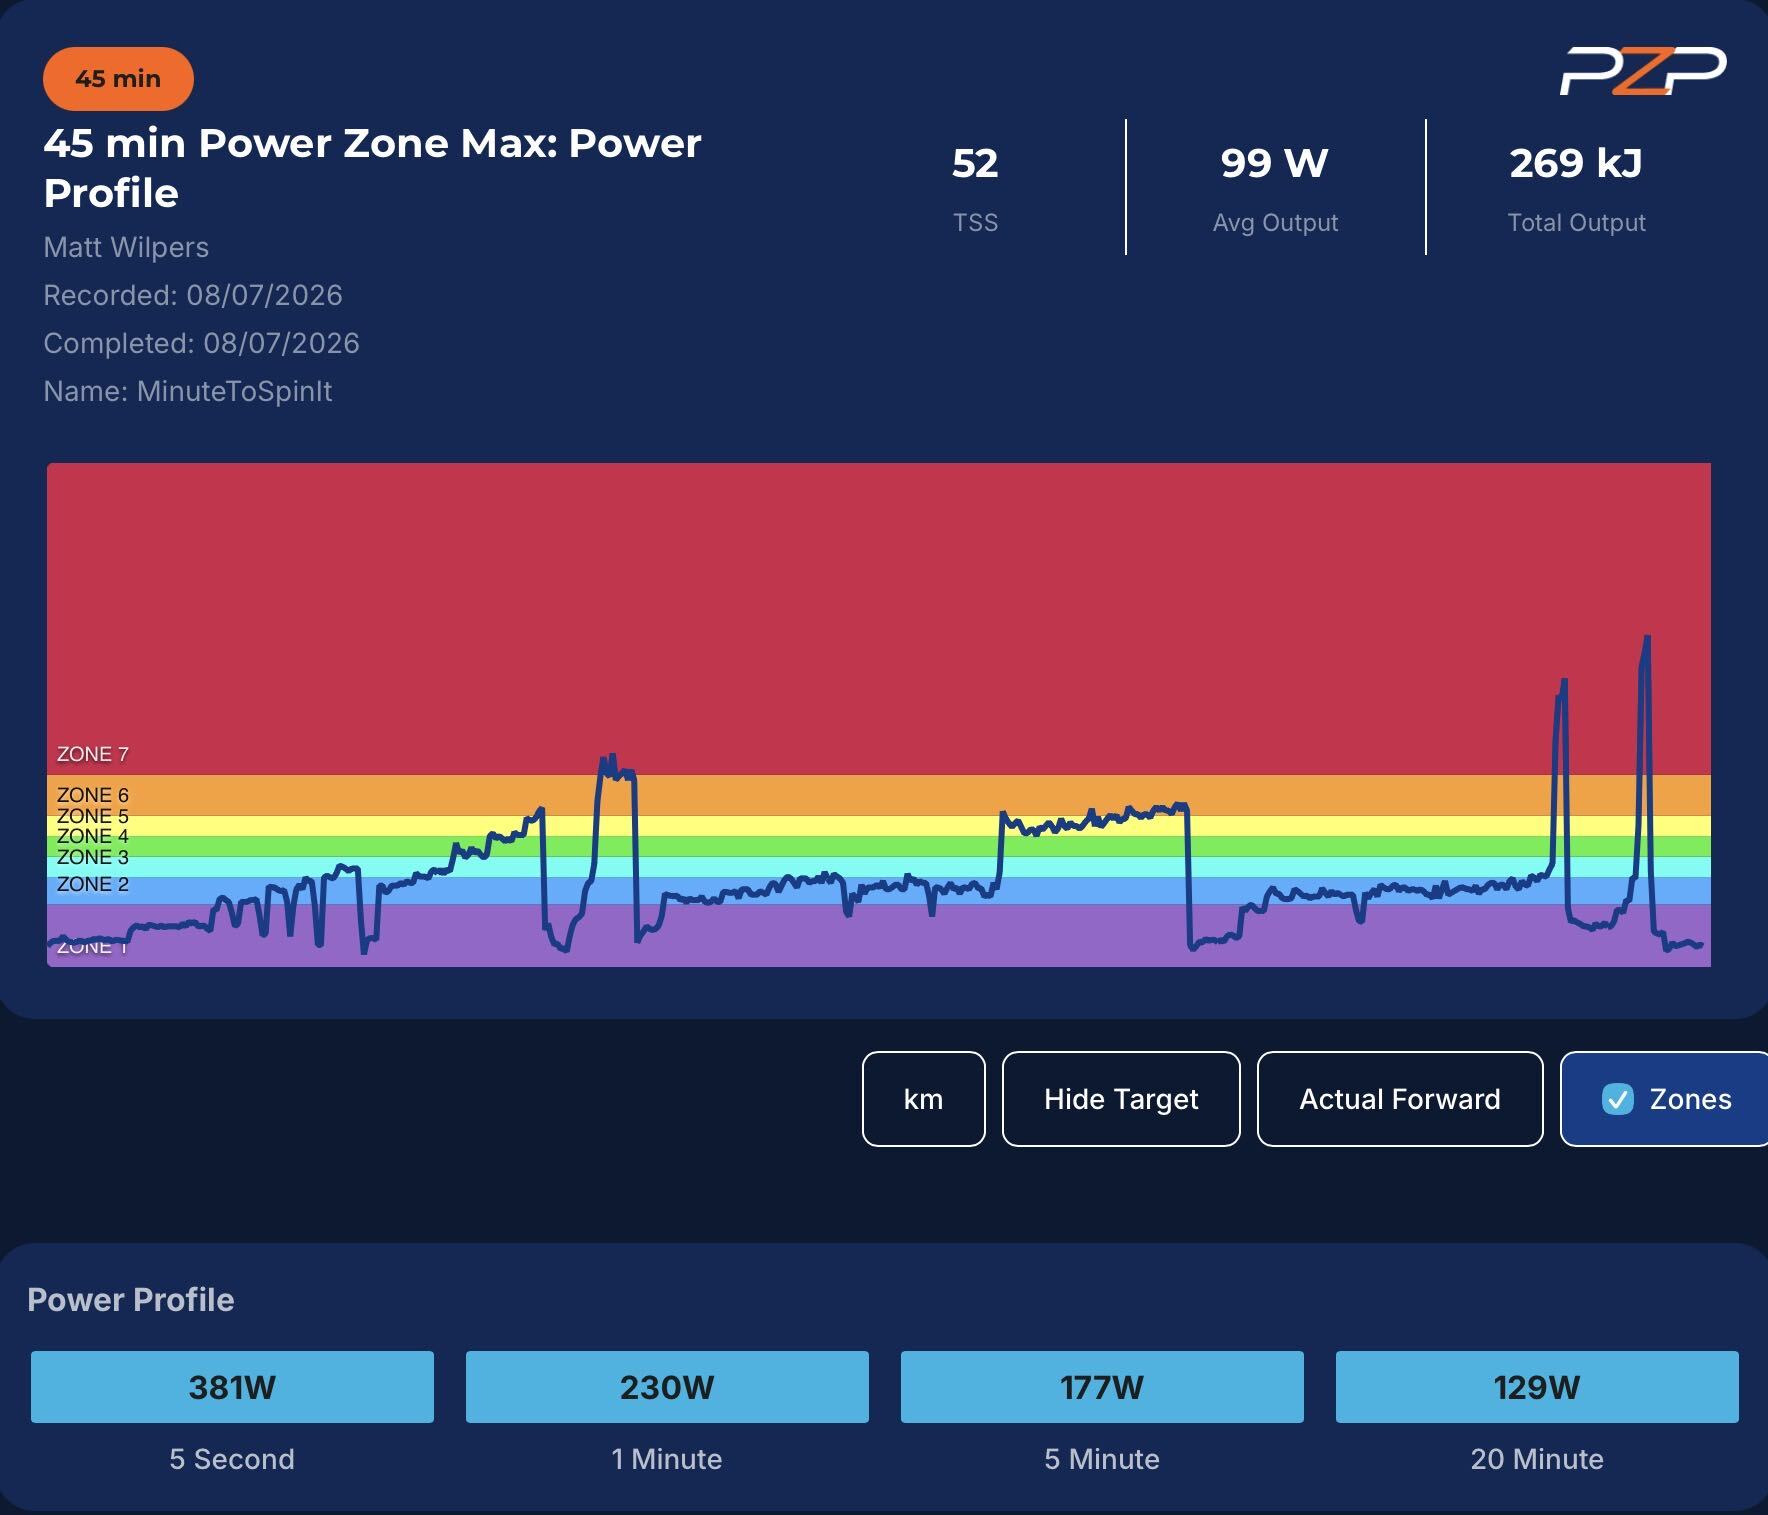
My post ride graph and Power Profile on the Power Zone Pack website
Because I am a Power Zone Pack subscriber, I had easy access to my effort averages, listed in the durations Matt noted right below my graph.
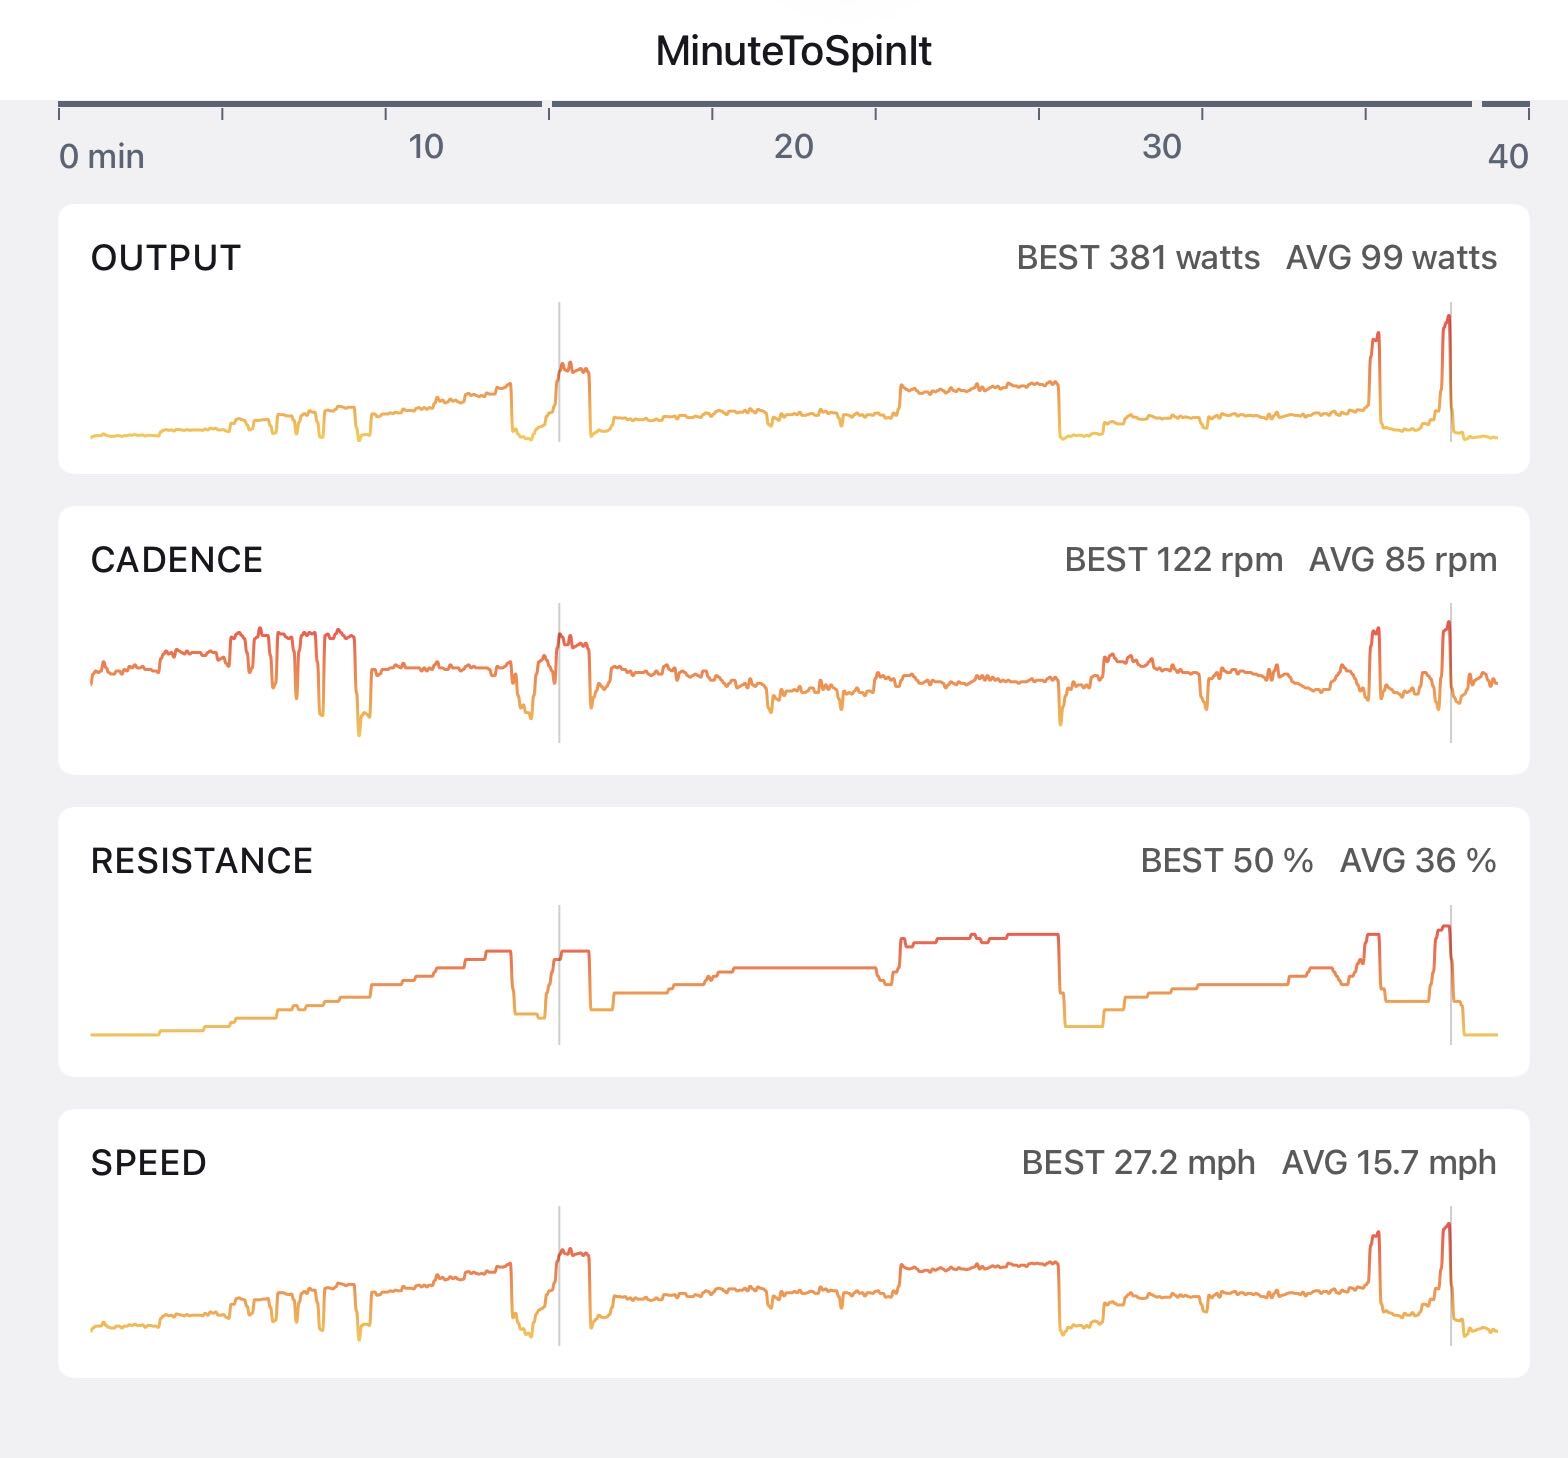
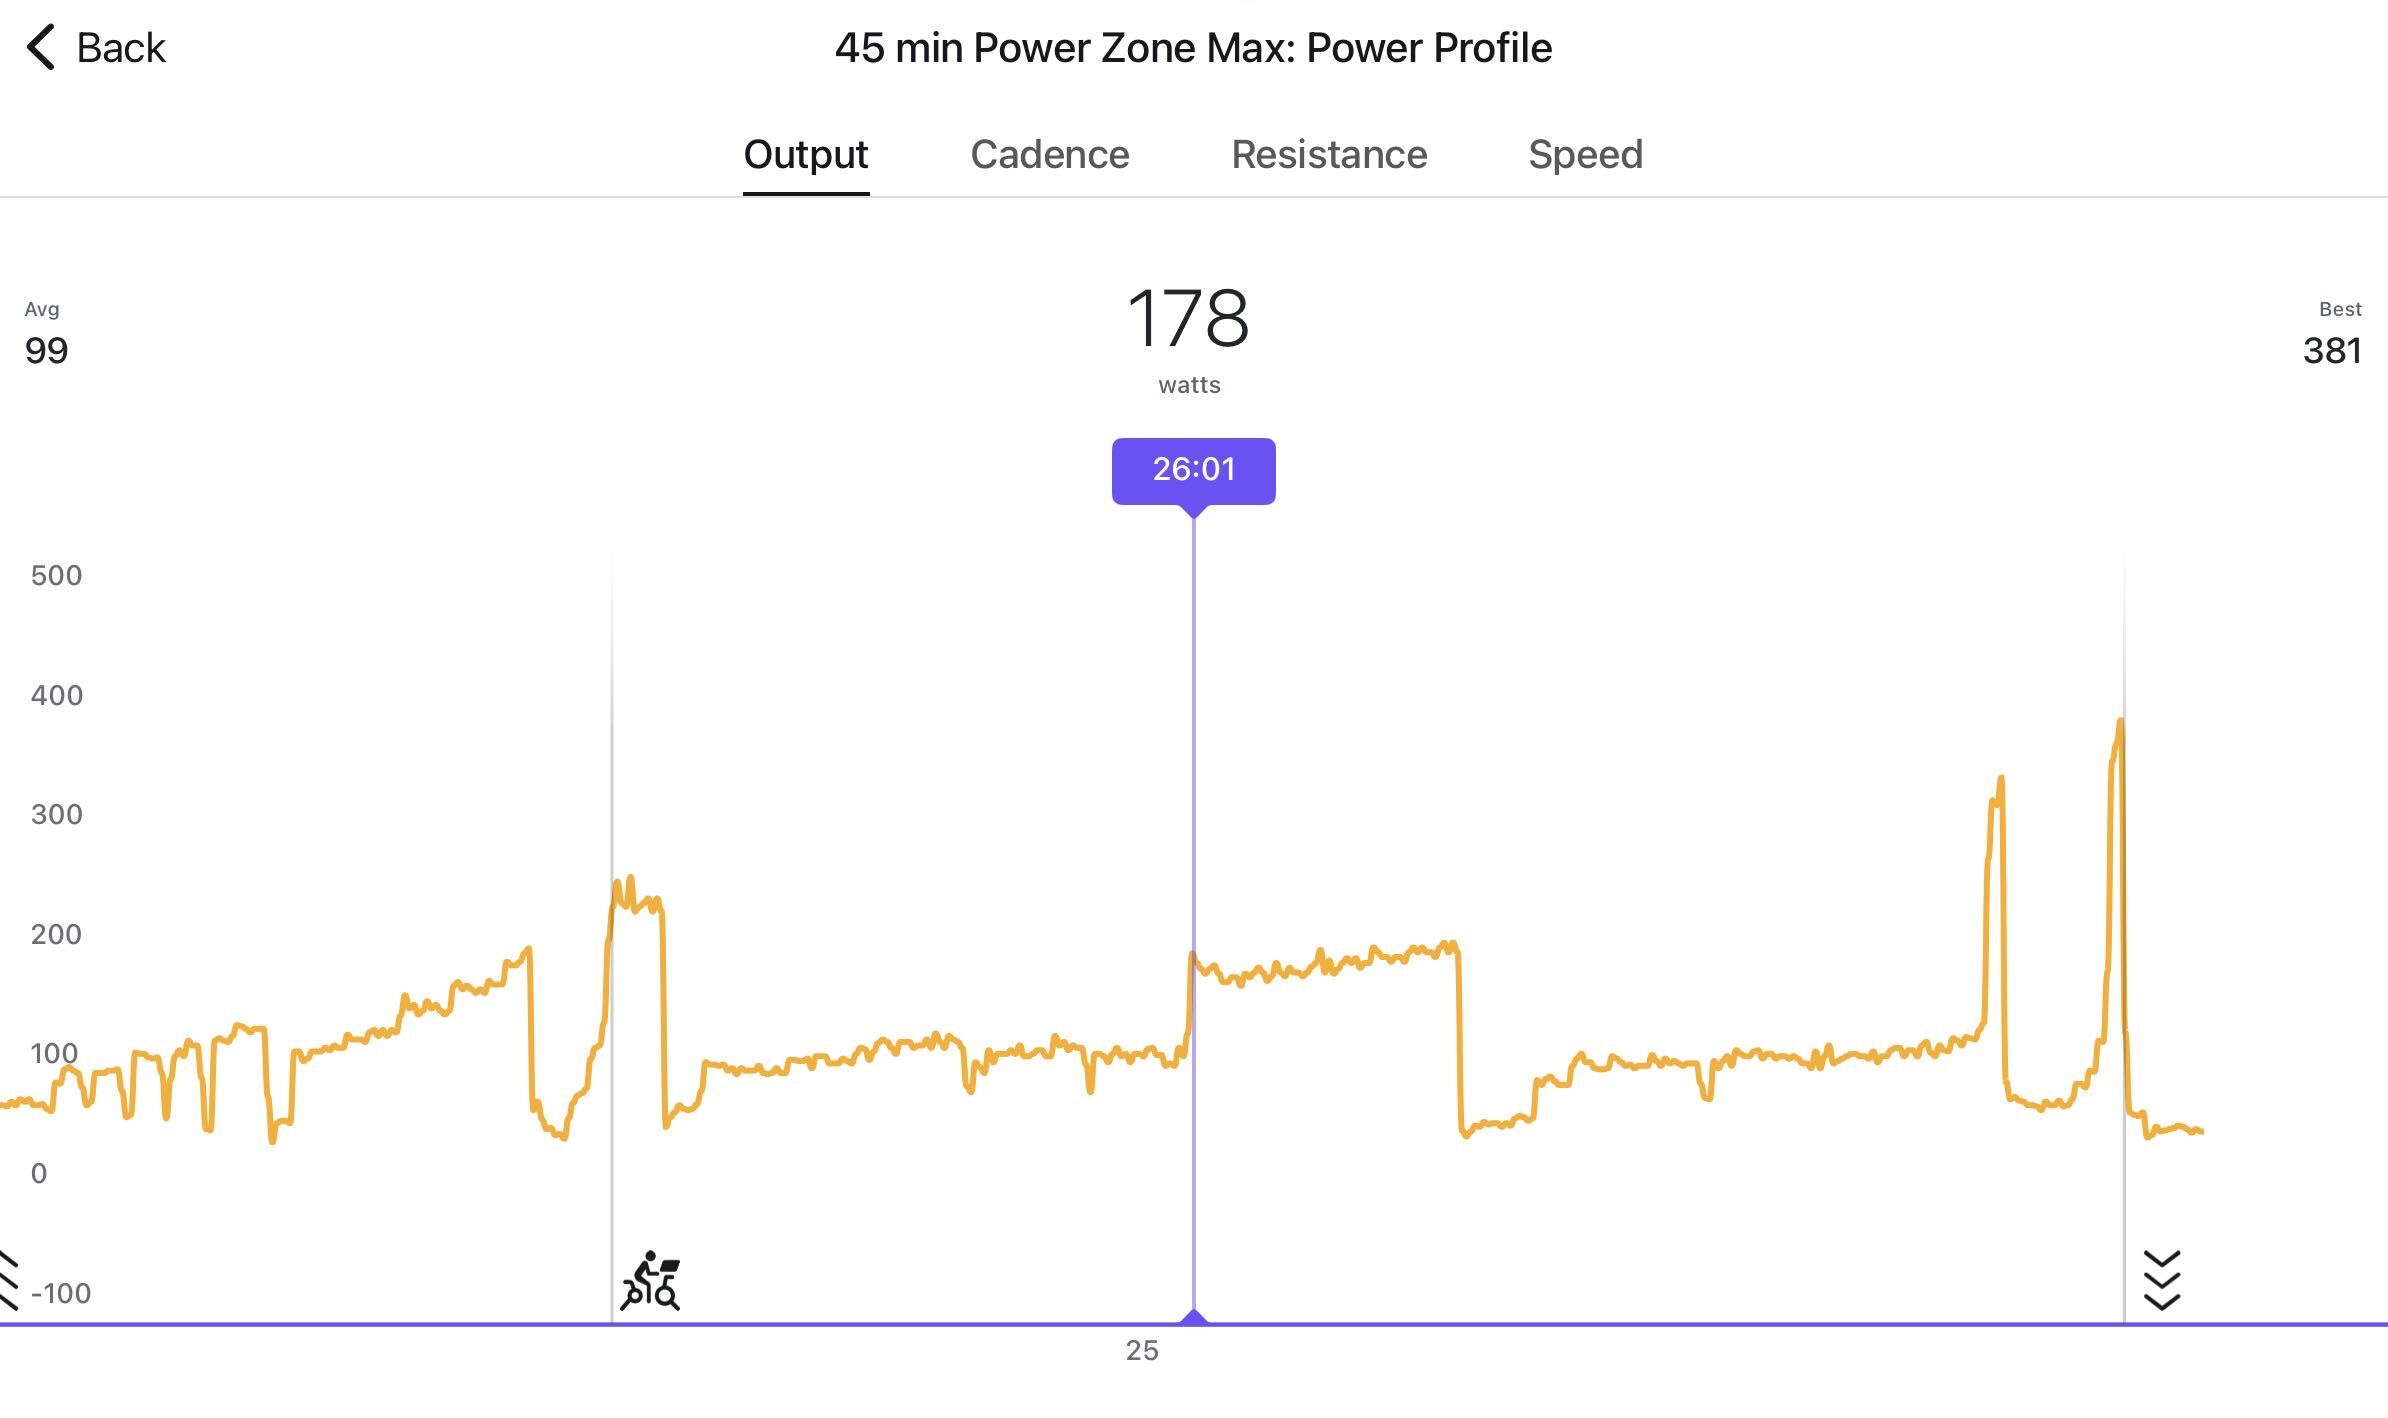
But I was wondering how other people would find this information if they are not part of PZP. Chatting to friends, I learned (after being a Peloton member since 2019!) that if you click on the column of graphs on the app in your History, a new window opens where you can slide the scroller across to really dig into your data! Wow, talk about “today years old!” So if this is you, you can go into the “Output” screen and do a little extra math to get your 5 Second, 1 Minute, and 5 Minute numbers before going to the chart.
How Did I Do
Based on the chart, here is where I landed at 54 kilograms. My 5-second average came out to 7.06 watts per kilogram, which falls in the Good range for Category III. My 1-minute average was 4.26 watts per kilogram, Moderate for Category IV. My 5-minute average was 3.28 watts per kilogram, also Moderate for Category IV.
According to my own read of that data, my explosive sprint output is technically my strongest attribute. I wouldn’t say that tracks with how I see myself, since I consider myself more of an endurance rider and SIT classes rarely go well for me by the end, but maybe the numbers are telling me to lean into that sprint power a little more.
What’s Next
With the big ride done, what’s left but to take it again? Matt’s framing of this ride as less of a test and more of an organized max effort helped calm my nerves going in. I was afraid of flaming out, and maybe I held back a little because of that. It was not an all-out slam like an FTP ride or a ramp test, and with so much active recovery built in, I can prepare even better for next time.
What will I do with this data? I’m honestly not sure. I’m not a data person by nature, but it is interesting to see where the numbers land. I suppose the only way to find out is to do it later this year and compare. I’ll be waiting for Matt’s instructions as to when!
Did you do this ride yet? Do you use Power Profile data?
The Clip Out is an independent Peloton news site with reporting, analysis, and community insights. We deliver breaking updates, feature reporting, and expert context on the stories driving the community and the industry.
Our weekly podcast offers deeper conversation and perspective, and you can find us on Apple Podcasts, Spotify, iHeart, TuneIn, and YouTube Music. You can also follow us on our socials on Facebook, Threads, Instagram, BlueSky, and YouTube.
See something in the Peloton universe that you think we should know? Visit us at theclipout.com and submit a tip.
About the Author: Elizabeth Schlosberg

Latest Podcast


Subscribe
Keep up with all the Peloton news!